Bereikbaarheid van grootschalige woningbouwlocaties
Seamus Joyce-Johnson 
Introduction
The Netherlands is planning to address the housing crisis by building new housing, with concentrations in several large-scale locations. These grootschalige woningbouwlocaties must have access to jobs and amenities by sustainable modes of transport—public transport, bicycle, and foot— to ensure that they are both sustainable and livable.
Public Transport
What about public transport? Are the large-scale housing locations accessible by train, bus, tram, and metro? Does the accessibility level vary within the housing area? Let’s take a look using the public transport accesibility level (PTAL) metric.
PTAL
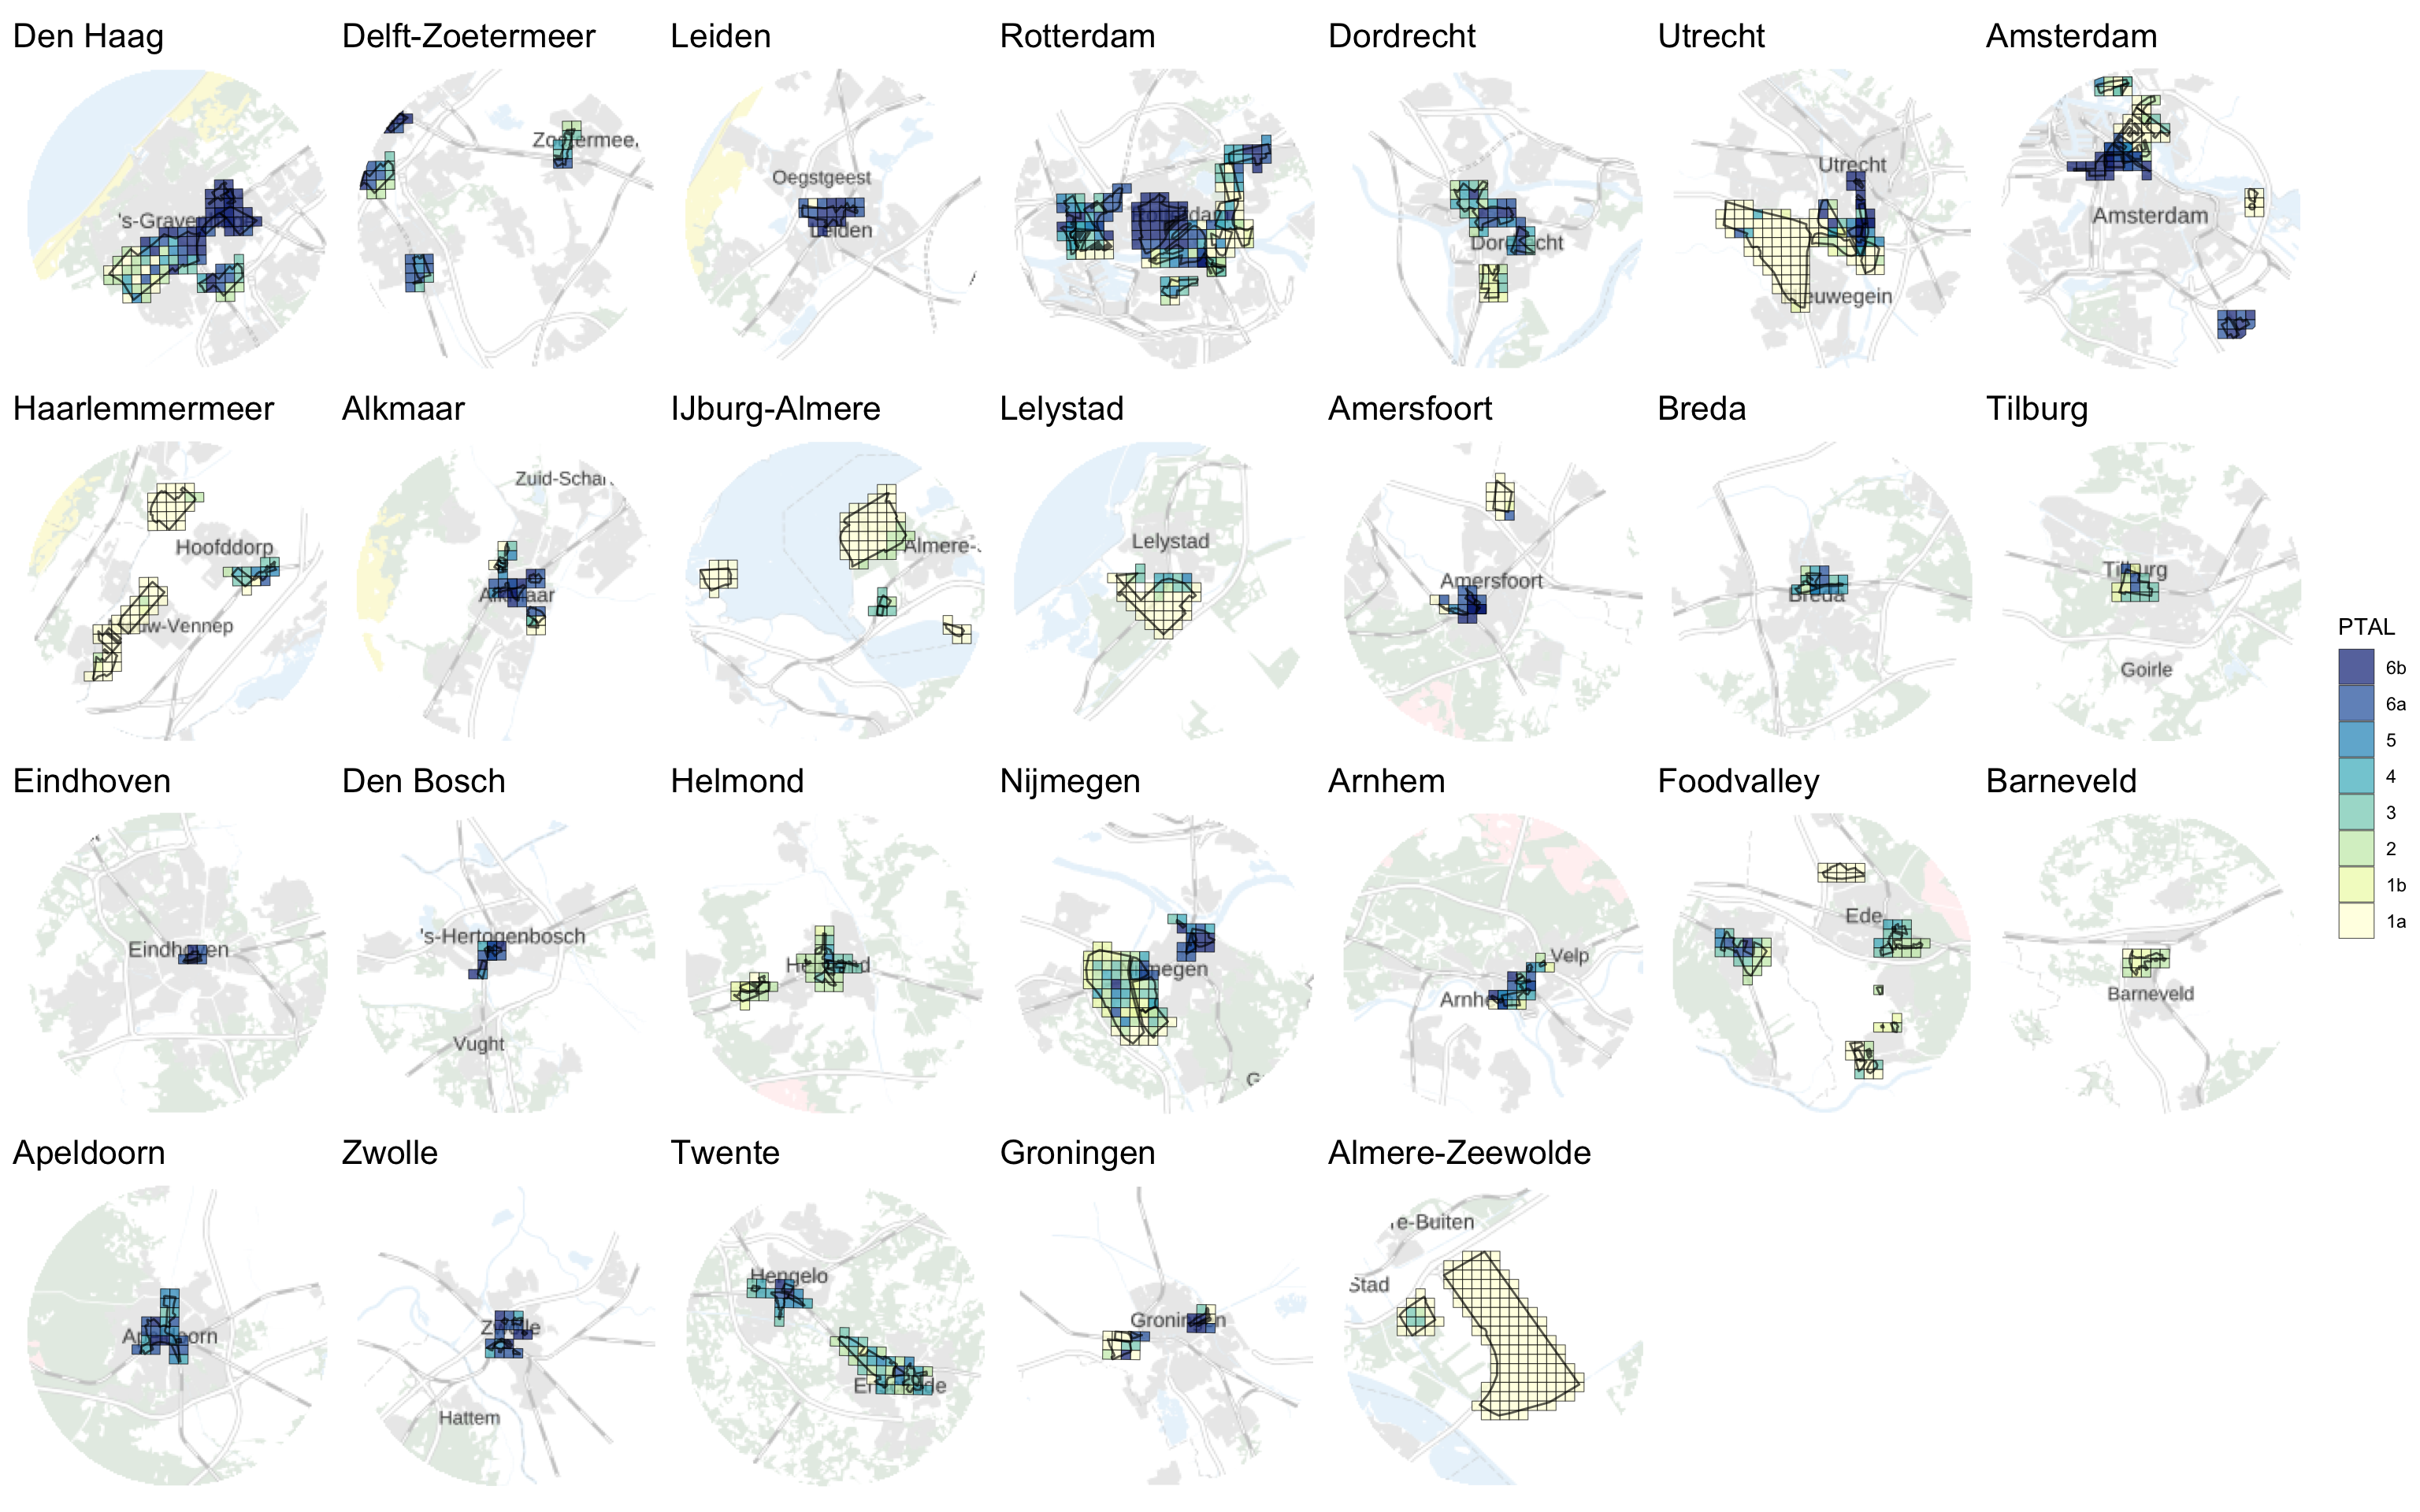
It immediately jumps out that several locations have particularly poor public transport accessibility. The largest are in:
- Flevoland (Almere, Zeewolde, and Lelystad)
- Haarlemmermeer
- Utrecht Rijnenburg
- Amersfoort A1 Zone
Housing density
Of course, it may still be worthwhile to build housing in public-transport poor areas if either:
- new public transport links are planned, or
- the proposed housing is low-density.
Or, put another way, we could tailor the housing density across multiple locations to build higher density in areas with high PTAL and low density in public transport-poor areas, while still achieving the same overall target number of units.
Let’s take a location-by-location look.
Cycling
In this analysis, we seek to develop a meaningful measure of the bicycle accessibility of the grootschalige woningbouwlocaties. This is a difficult task because of their large-scale nature—as these locations are often whole new urban districts with associated new street infrastructure, amenities, and even jobs, assessments of existing cycling infrastructure give an incomplete picture.
Therefore, we choose to focus our analysis on job accessibility, as employment opportunities and locations are less likely to change with the development of new housing, when compared with street infrastructure itself or amenities within neighborhoods.
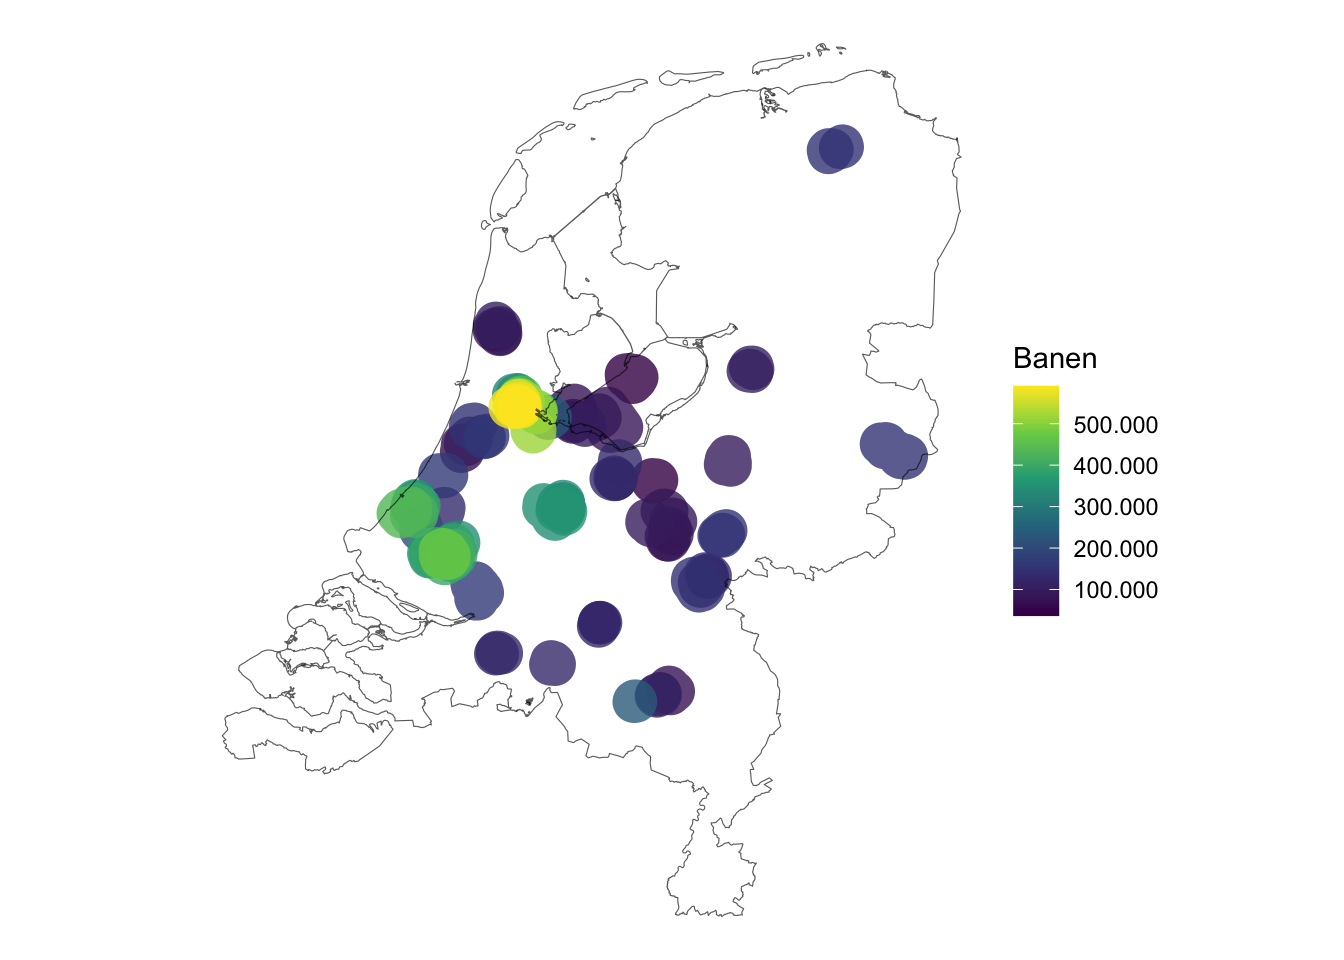
As a rudimentary approach, we can consider the number of jobs available within cycling distance of the new housing areas and make comparisons between them.
A more advanced analysis could distribute hypothetical new citizens across these housing areas and calculate job accessibility metrics for them on an individual basis.
Existing jobs within cycling distance
City planners typically use 7,5 km as the maximum distance cycled to work in the Netherlands, with 15 km for e-bikes. We can therefore take a 7,5 km buffer around the large-scale housing areas as a very rough estimate of the bike-accessible employment area.1
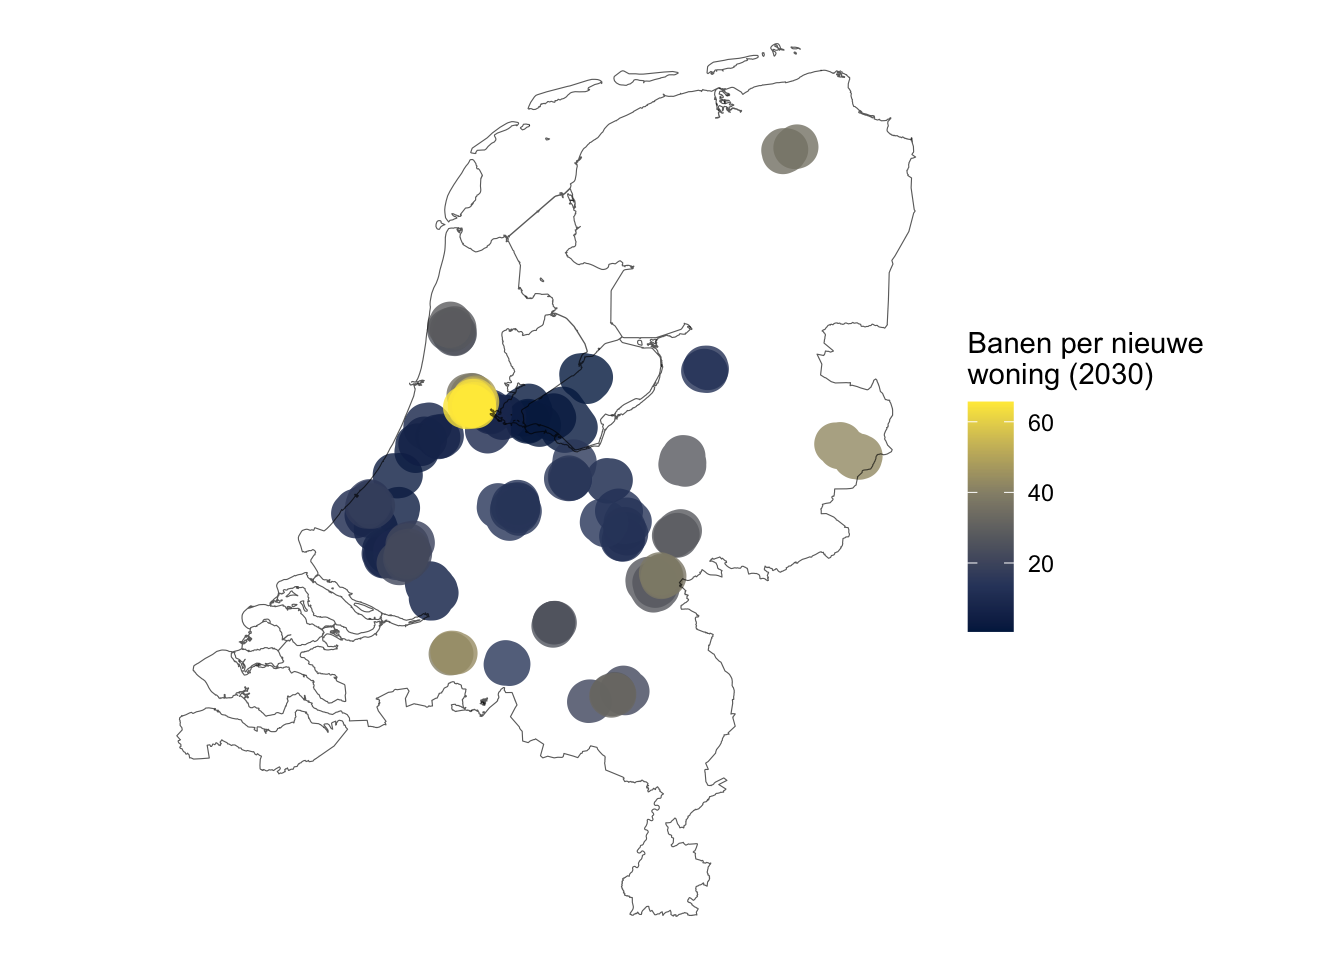
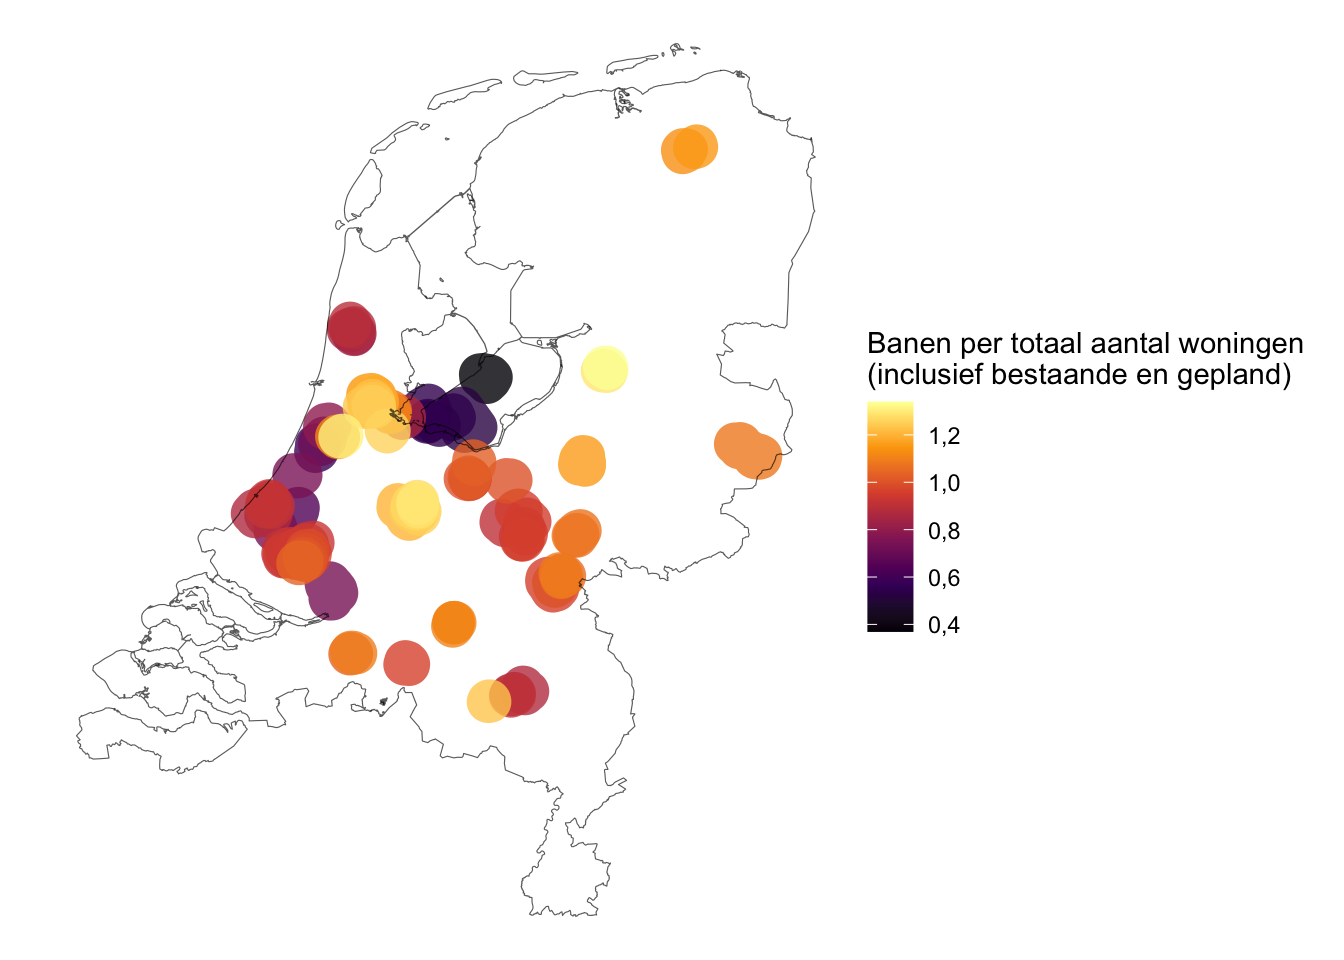
We then count the number of jobs available in these employment areas and normalize by the expected number of new households in 2030.
Then, we can plot these.
Footnotes
The actual area is smaller, because it would reflect network distance rather than crow-flies distance and account for the fact that not all residents live on the edge of the area.↩︎